Anyone working with polymers and their properties should know something about what is known as the molecular weight distribution. What it is, how it can be determined using gel permeation chromatography, and what a materials scientist can learn from it is explained here.
Not All Plastics Are the Same
Plastics that are built from exactly the same monomers can still differ greatly in their properties. A well-known example is polyethylene, which in its HD variant has high density and stiffness, while the LD variant has a lower density and is flexible. Both types of plastic are composed of ethylene units, but differ in molar mass and degree of branching. This degree of branching, the two- or three-dimensional structure, and the chain length of the polymers determine the physical properties of the plastics produced from them.

Gel permeation chromatography (GPC), also known as size exclusion chromatography (SEC), is one of the most important methods for characterizing polymers in modern polymer analysis and has a firm place in research, development, and quality control.
By coupling it with a wide range of detection methods, gel permeation chromatography can also provide information on molecular mass as well as the degree of branching in a single analytical run.
Plastic Properties Depend on Structure
A plastic consists of polymers with a wide range of chain lengths, which may be branched or linear. They can be built from one or several monomer units. This variety of processing options makes it possible to produce materials with tailored properties.
")
")
Polyethylene (PE) is a good example of the influence of branching and molecular mass. Slightly branched high-density polyethylene (HDPE) is a rigid material with high stiffness and density. In contrast, low-density polyethylene (LDPE) is a highly branched polymer with low density and a softer, more flexible material.
High-molecular-weight polyethylene (PE-HMW) with a molecular weight of around 500,000 g/mol and ultra-high-molecular-weight polyethylene (PE-UHMW) with a molecular weight of up to 10,000,000 g/mol are plastics that differ from “normal” PE primarily through their high abrasion and impact resistance. Different degrees of branching and molecular masses are responsible for the various properties of plastic semi-finished products. If you want to produce a specific polyethylene, you need to understand its structure and molecular mass. This is where gel permeation chromatography comes into play.

What Is Included in Gel Permeation Chromatography?
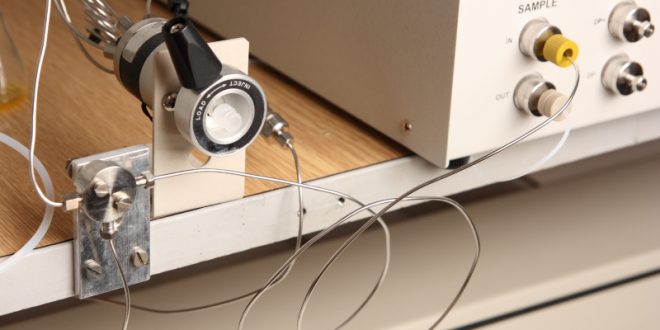
A GPC system consists of a separation column on which the components of the sample are separated, a pump that ensures a constant mobile-phase flow, and one or more measuring instruments—so-called detectors—that detect the individual components separated on the column. The detectors measure a specific property of the components, for example absorption at a particular wavelength.
When a component elutes from the separation column, it passes through the detector and produces a signal that is recorded. The sample can be injected manually or using an autosampler. The column material of a GPC column has a defined pore size over a specific size range. Depending on the sample and mobile phase, different column materials are suitable: styrene-divinylbenzene (SDV) is used for separations with organic mobile phases such as hexafluoroisopropanol or trifluoroethanol, whereas methacrylate-based columns are a good choice for aqueous samples and mobile phases.

Gel Permeation Chromatography Separates Solely by Size
In gel permeation chromatography, molecules are separated by their size—more precisely by their hydrodynamic volume. Each macromolecule exists in a more or less coiled form and is surrounded by a solvent shell; the combination of molecule and solvent shell determines the measured hydrodynamic volume. Separation in gel permeation chromatography depends solely on the ability of the molecules to diffuse into the pores of the column material. Small molecules diffuse into the pores of the column packing and remain there longer than larger molecules. Larger molecules pass through the column without “detours” and elute first. The elution volume can therefore be used to infer the size of the molecules.

To determine this, standard molecules of known size are separated first. Their elution volumes can then be assigned to their known molecular weights. This creates a so-called calibration curve: the retention volume is plotted on the lower x-axis—i.e., the number of milliliters after which a given standard molecule has eluted.
The corresponding value is plotted on the y-axis. Because these values differ greatly, ranging from 2,000 g/mol to 640,000 g/mol, the y-axis would have to span many orders of magnitude.
A common workaround is to plot not the actual molecular weight, but its logarithm. This keeps the ratios the same while making the plot easier to read. When the unknown sample is then separated, the individual fractions can be assigned to a specific value on the calibration curve based on their elution volume. In this way, the relative molecular weight is determined in polymer analysis.
It must be kept in mind that hydrodynamic volume also depends on the shape of the polymer being measured. If it is more rod-like than spherical, the result measured in this way can be higher than the actual value. It is therefore essential to match the standard to the sample. If a polystyrene sample is being measured, polystyrene molecules of known size should also be used as the standard, since they have the same shape and therefore the same hydrodynamic volume.

Molecular Weight Distribution and Polydispersity Are Important Parameters in Polymer Analysis
When plastic samples are separated by GPC for polymer analysis, the elugram does not appear as a sharp peak, but as a more or less broad peak. This reflects polymers with different chain lengths, and the shape and width of the eluted peak allow conclusions to be drawn about the molecular weight distribution. The distribution width, or polydispersity, indicates, for example, the relative number of molecules with different chain lengths. If all polymers have the same length, the polydispersity factor is one, whereas higher values indicate a broader distribution.
For quality control, molecular weight distribution can be an important parameter that is routinely measured in polymer analysis—for example, when specifications require that only a certain percentage of polymer chains may exceed or fall below a given length. In synthesis, for instance in the production of block copolymers from two different components, measuring the molecular weight distribution in the reaction mixture at different times can help monitor reaction progress. In addition to molecular weight distribution, the degree of branching of the polymers is an important feature of polymer characterization.
The monitoring of synthesis processes, materials testing of copolymers and polymer blends, and checking for undesired by-products or remaining starting materials are also key topics that polymer analysis can address using gel permeation chromatography. The detection systems used play an important role here, because depending on the detector applied, a different parameter can be determined.

Polymer Analysis Uses Different Detectors to Determine Different Parameters
Refractive Index Detectors
In gel permeation chromatography, the refractive index detector is used as the standard detector. The change in refractive index is directly proportional to the concentration of macromolecules in a solution. This means the relative molecular weight can be determined from the comparison of elution volume and calibration curve, while the refractive index signal can be used to calculate the concentration of the individual fractions as well as the molecular weight distribution.
Low-Angle Light Scattering Detectors
Sometimes polymer analysis aims to determine the absolute rather than the relative molecular weight. In this case, the individual fractions from gel permeation chromatography are measured using a low-angle light scattering detector. Its scattering signal is directly proportional to the weight-averaged molecular weight of a sample. If the concentration, the refractive index increment of the sample, and the calibration constant of the light scattering detector are also known, the absolute molecular weight can be calculated directly from the area under the measured scattering signal. Combining refractive index and light scattering detectors makes it possible to determine absolute molecular weights without having to create a calibration curve.
Viscometry Detectors
Finally, viscometry detectors are used in gel permeation chromatography when information about polymer structure is required. The polymer sample is forced through a narrow capillary, and the pressure difference is measured in comparison with a second reference capillary. If the concentration of the sample is known, the pressure difference can be used to calculate the so-called “intrinsic viscosity,” which can be visualized as the density of a polymer coil.
")

If the intrinsic viscosity and the molecular weight (more precisely, the molar mass average) are known, the degree of branching of a polymer can be determined. The empirically derived Mark–Houwink equation describes this relationship. If the logarithm of the determined intrinsic viscosity is plotted against the logarithm of molar mass in a Mark–Houwink plot, the resulting line and its slope can be used to draw conclusions about polymer structure.


For example, slope values greater than 0.8 are typical of an open-chain structure. Values between 0.6 and 0.8 indicate a coil-like structure, and values below 0.6 are typical of very compact molecules, which are usually also branched.
By combining all three detectors, very comprehensive sample and polymer characterization is possible—which is why GPC has become indispensable in modern polymer analysis.
However, it reaches its limits when dealing with highly branched or very high-molecular-weight polymers. In such cases, asymmetrical flow field-flow fractionation can be used as an alternative for polymer analysis. In all other cases, though, GPC remains the method of choice, primarily because it is relatively easy to establish and does not require overly complex instrumentation.